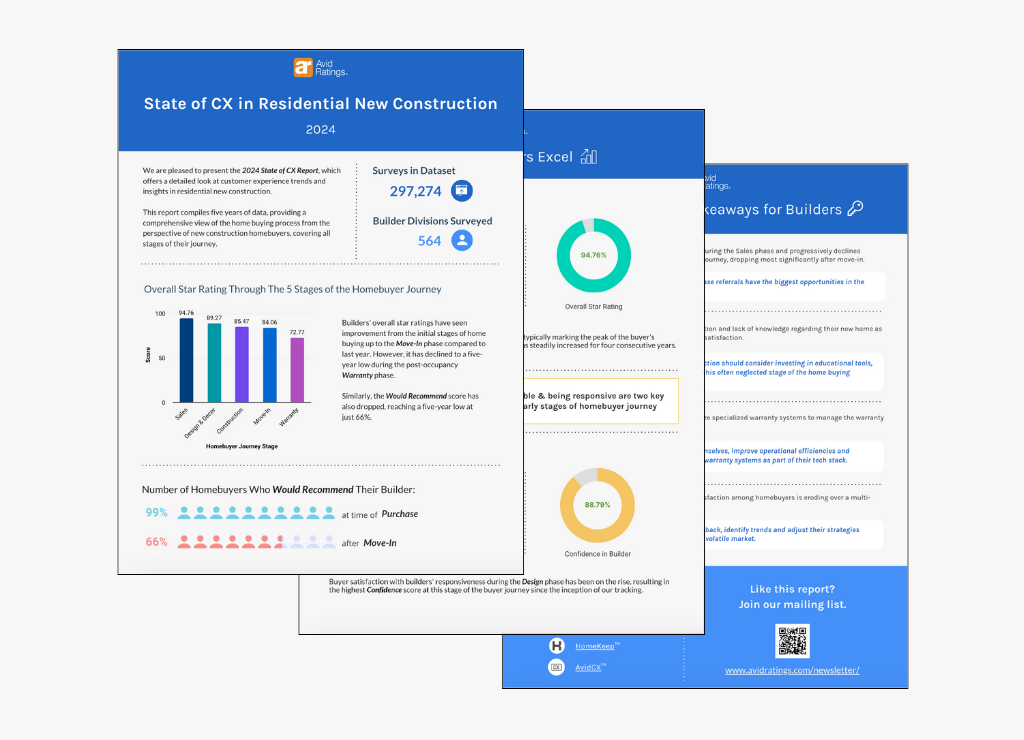
The only 360° industry specific customer experience platform on the market. Learn why more top homebuilders leverage AvidCX™ to measure, analyze, benchmark and improve every step along the homebuyer journey.
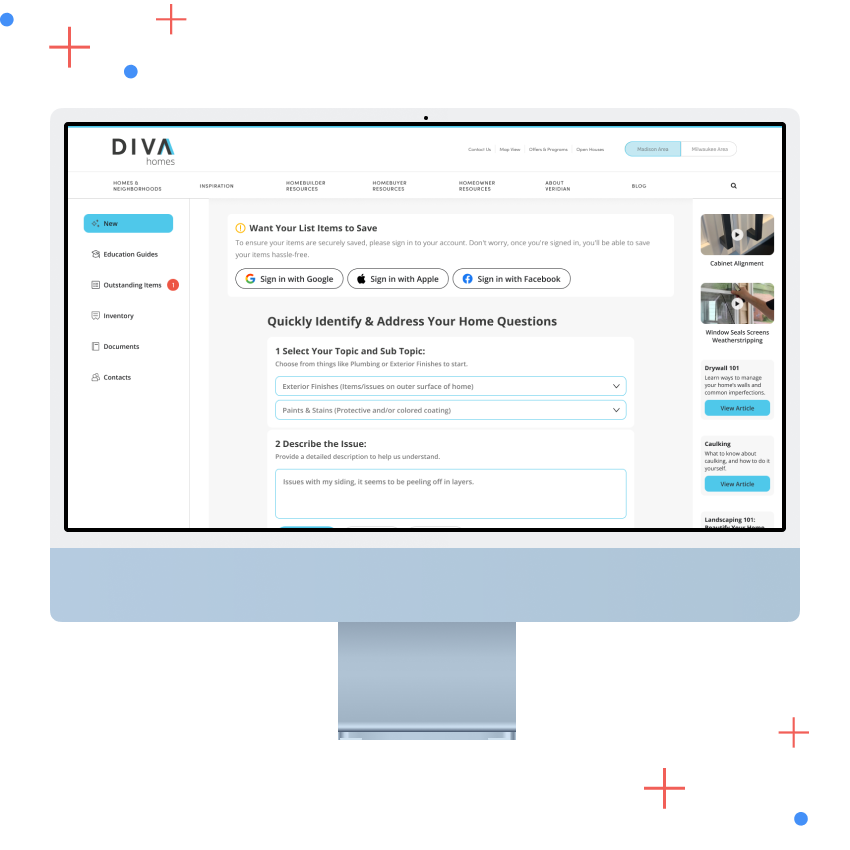
HomeKeep enhances the post move-in experience by initially focusing on minimizing warranty costs and claims for homebuilders, while continually educating homebuyers well beyond the warranty period.